Exploratory Analysis & Setpoint Study
The first phase established which factors drive energy consumption and what constitutes a good temperature setpoint. Pearson correlations were computed across both short (3h) and long (1yr) time windows to identify stable relationships. A dedicated setpoint analysis divided operating conditions into outside-temperature ranges and found local optima for each — the first principled basis for setpoint selection in the installation.
- Correlation analysis over short and long time horizons to identify energy-driving features
- Energy consumption unit transformation and distribution comparison
- Setpoint optimality study segmented by ambient temperature bands
- Initial regression model for forecasting process variables at time advance x
Time-Series Modeling & Data Quality
The second phase attempted mathematical modeling of the system (AR, ARIMA, ARIMAX, LSTM) and found that data quality was the limiting factor — noise from maintenance periods, warm-up cycles, and sensor artefacts obscured most structure. This prompted a systematic data quality improvement effort across three methods.
- Compared AR, ARIMA, ARIMAX, and LSTM on five held-out datasets; stationarity verified with Augmented Dickey–Fuller
- Rule-based filtering using operator field knowledge — 13 rules, reducing the dataset by over 75% while significantly improving signal quality
- Inverse variance weighting via generalised variance of the covariance matrix to down-weight noisy periods
- Outlier detection: Isolation Forest, Mahalanobis distance, Local Outlier Factor, and One-Class SVM — algorithms compared on predicted inlier/outlier assignments
Predictive Control & Automation
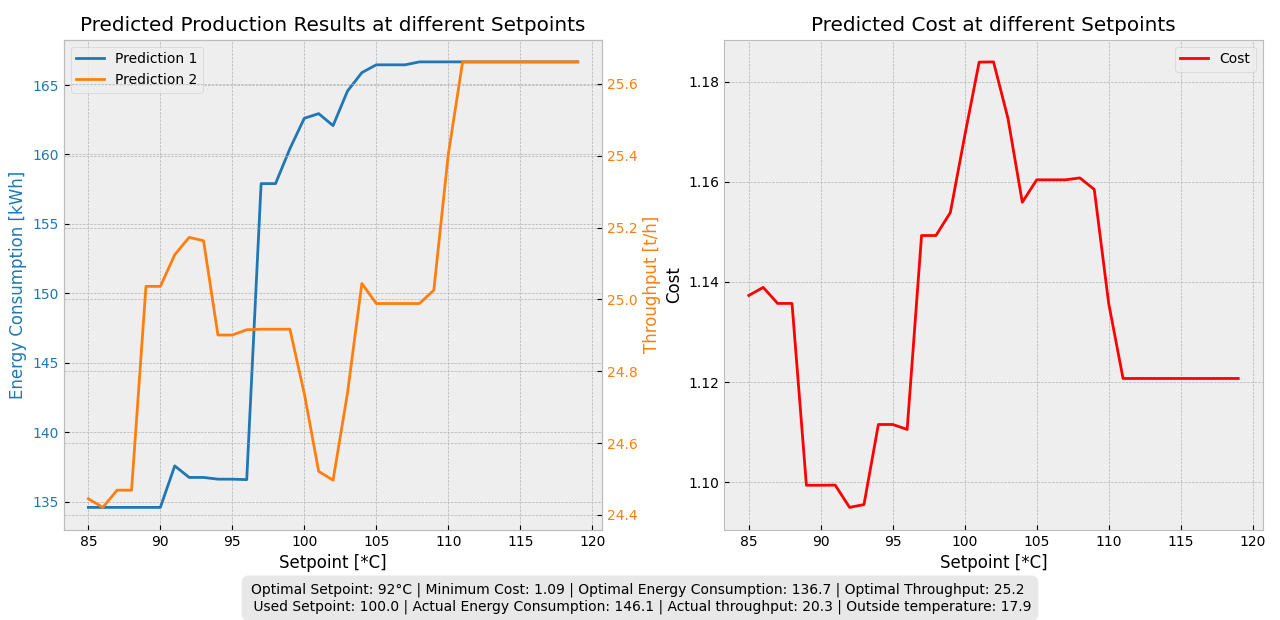
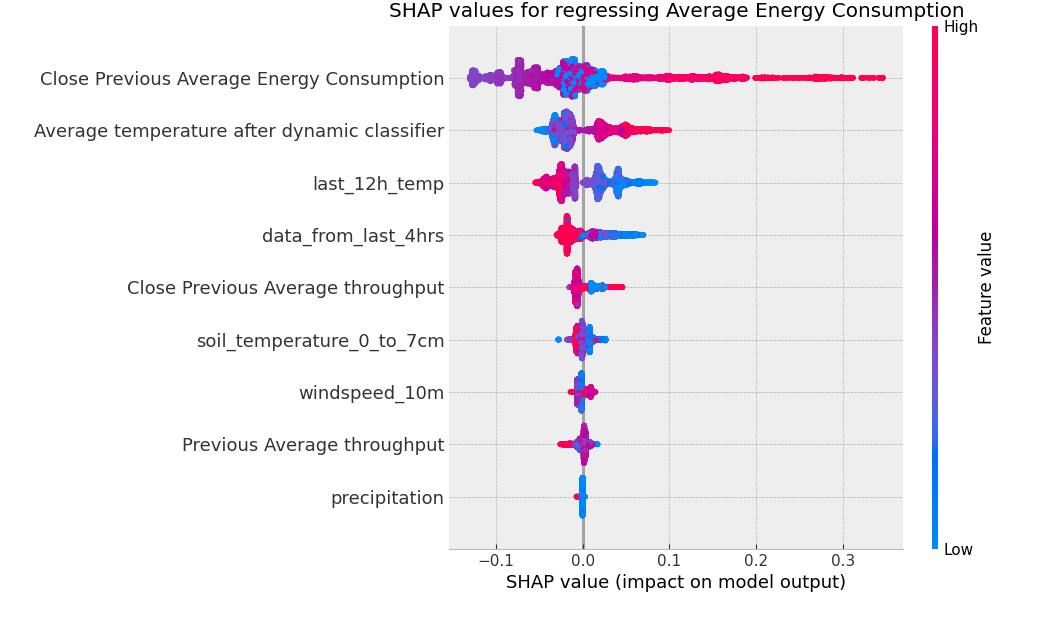
The final phase built a model predictive control (MPC) system to automate setpoint selection. Four ML models — Linear Regression, Decision Tree, Random Forest, and XGBoost — were tuned and compared for forecasting energy consumption and throughput. XGBoost performed best (MAE = 0.081, R² = 0.51 on standardised data) and was used in the final pipeline. Feature analysis across all models consistently identified lagged production values and outside temperature as the dominant drivers — confirming that the setpoint and ambient temperature are the only levers worth optimising. The system evaluates a cost function over all candidate integer setpoints (80–120°C) and selects the one with the lowest combined cost.
- Four regression models compared: Linear Regression, Decision Tree, Random Forest, XGBoost — XGBoost best across MAE, MSE, and R²
- Feature importances computed per model: lagged throughput and energy consumption dominate; setpoint and outside temperature are the key controllable factors
- Cost function C = w₁E + w₂(1/T) with equal weights, minimised via grid search over integer setpoints 80–120°C
- Welch t-test on outcome distributions: throughput gain significant (p = 0.001), energy gain not significant (p = 0.487)
- End-to-end pipeline: weather forecast → predict outcomes at each setpoint → select optimal → 2.6% energy reduction, 8.9% throughput improvement over operator baseline